Product Categories
Contact us
SHENZHEN 3NH TECHNOLOGY CO., LTD.
Address:4/F, Building 8, Nangang Second Industry Zone, Xili, Nanshan District,Shenzhen, China.
Phone:+8613530843649
Q Q:2489597314
Skype:hfw-angel
E-mail:gina@3nh.com
chenqiang@3nh.com
Tel: +86-755-26508999-639
Fax: +86-755-27190609
Address:4/F, Building 8, Nangang Second Industry Zone, Xili, Nanshan District,Shenzhen, China.
Phone:+8613530843649
Q Q:2489597314
Skype:hfw-angel
E-mail:gina@3nh.com
chenqiang@3nh.com
Tel: +86-755-26508999-639
Fax: +86-755-27190609

Name:
TE097 D High Resolution Test Chart Transmissive
Categories:Camera Testing Charts
Brands:
Model:


Product details
TE097 D High Resolution Test Chart Transmissive
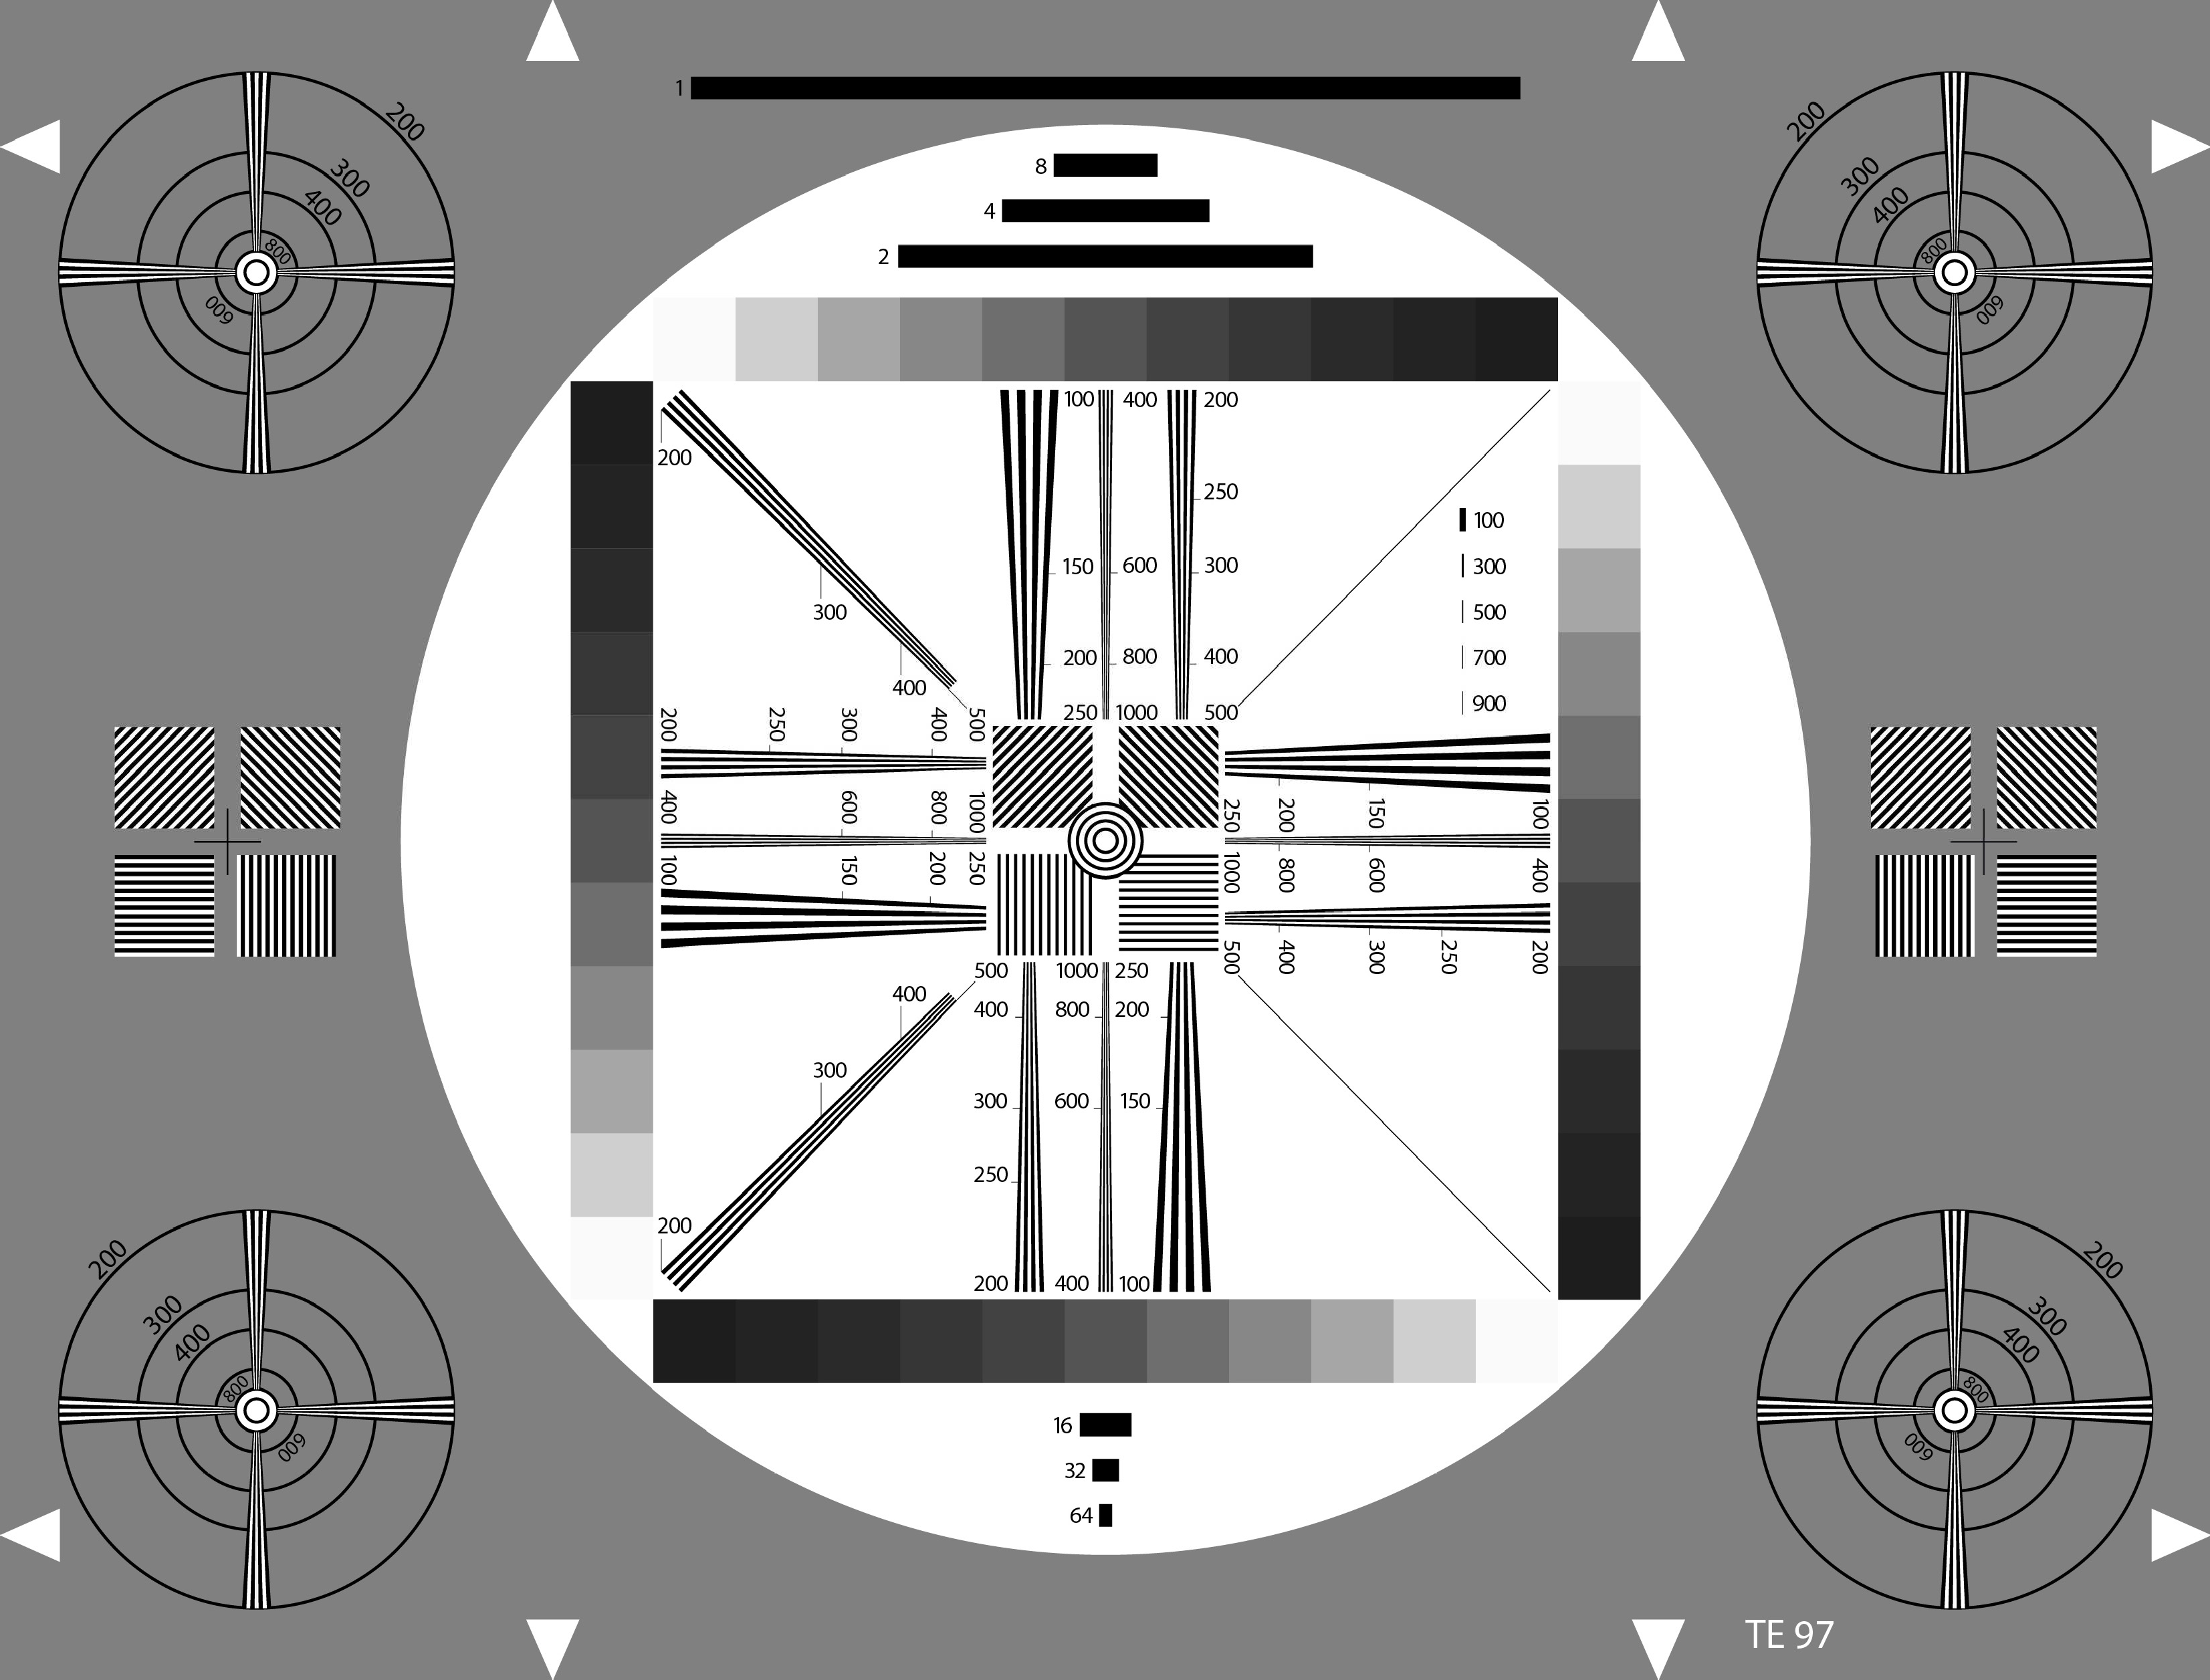
The TE97 corresponds to the 4:3 part of the HDTV test chart TE117. It is designed for measuring and quick (most visual) appraisal of transmission characteristics of high resolution non-broadcast cameras.
In the center of the test chart on a gray background (D=0.75; reflectance = 18%) a white circle with four gray scales of 11 steps each is located. They are graduated in equal linear steps from D=0.15 to D=1.65 and are used for checking halftone rendition of cameras. Due to the white surrounding area the results may, however, be qualified.
On both sides of this central circle four circles with resolution wedges are arranged.
All frequency values in the test chart are indicated in cph (cycles per height). In the central circle three resolution wedges with different frequencies are arranged vertically and horizontally. They reach from 100 to 250, from 200 to 500 and from 400 to 1000 cph. In addition, two resolution wedges angled in 45°generate frequencies of 200 to 500 cph.
In the middle of the test chart and on the left and right sides there are four squares with multi bursts that are inclined at angles of 0°, 45°, 90°and 135 °generate a different frequency (141.4 cph) in horizontal and vertical direction (due to their inclination). The inner white and the four outer circles enable a rough appraisal of the scan linearity. The outer ones show cross-shaped resolution wedges. The circular rings, which can also be used for checking geometry, are designed for marking the resolution in vertical and horizontal direction. Resolution is shown at 200, 300, 400, 600 and 800 cph.
In the center of the test chart both in the gray and the white area bar elements are arranged with a length of 1 (= half the picture-height), 2, 4, 8, 16, 32 and 64 cph. Left of the right vertical gray scale
there are five additional short bars with 100, 300, 500, 700 and 900 cph.
- PRE : NONE
- NEXT : TE097 A HIGH RESOLUTION TEST CHART REFLECTIVE
